|
Overview: Population Birth rates Immigration Solutions Numbers Cites Terms |
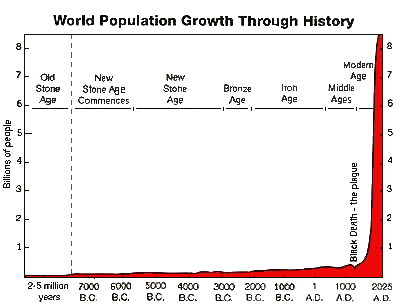
World population growth
World population continues to increase.
With current world population now over 6 billion people,4, 52
there is significant pressure for excess population to migrate from more
densely populated countries to those less populated.
|

|
U.S. population growthThe top line of the following graph shows actual U.S. population from 1970 to 1993, and the U.S. Census Bureau "medium projection" of total population size from 1994 to 2050.2 It assumes fertility, mortality, and mass immigration levels will remain similar to 1993. In fact, overall immigration has continued to rise significantly, meaning that population growth will actually be higher than shown below.31 |

Sources: U.S. Census Bureau; demographer Leon Bouvier11 |
|
Immigration numbersHistory shows the U.S. has traditionally allowed relatively small numbers to immigrate, thus allowing for decades of assimilation. After the peak of about 8.7 million in the first decade of the 20th century (the "great wave"), numbers went steadily down. Immigration averaged only 195,000 per year from 1921 through 1970!40 |

* Projections and graph courtesy
Population Environment Balance,
Sources: U.S. Census Bureau2; Statistical Yearbook40, Bureau of Citizenship and Immigration Services |
It is helpful to put current immigration statistics in perspective. With
the change in immigration law in 1965, mass immigration levels have drifted upward
from 250,000 per year to over 1 million per year. In other words, in one
year we accept a number equal to what we formerly took in five years;
in two years what took a decade, etc. In response to such concerns a
national bipartisan committee headed by the late Barbara Jordan
concluded that the numbers should be reduced.45, 46, 47
A recently released RAND report41 recommends that the level be reduced.
|
Can not solve third-world population problemsU.S. overimmigration does not relieve overpopulation problems in third-world countries. Over 4.9 billion people live in countries poorer than Mexico.43 Each year the populations of the world's impoverished nations grow by tens of millions. Mexico grows by 2.5 million per year, Latin America by 9.3 million, South America by 5.4 million, and China by 8.3 million.4 U.S. overimmigration cannot have any significant affect on this number, even at current high mass immigration levels of over 1,000,000 per year. Exponential growthU.S. population is projected to double.2 Although current population growth rates are not strictly exponential, an analysis of exponential growth44 reveals how quickly a population can grow. Exponential growth is like compound interest. With 1% growth rate, population will double in 70 years, a 2% growth rate will cause doubling in 35 years, 10% in 10 years. (Divide 70 by the percentage number to get the approximate doubling time). U.S. population has grown by 1.2% per year over the last 50 years. This "low" growth rate means it has taken only 58 years for our population to double. We can expect this doubling to continue, drastically magnified by the impact of unrealistically high levels of mass immigration. |
Rate of Population |
Years Required to |
0.01% |
6,930 |
0.1% |
693 |
0.5% |
139 |
1.0% |
70 |
1.5% |
47 |
2.0% |
35 |
2.5% |
28 |
2.8% |
25 |
3.0% |
23 |
3.5% |
20 |
4.0% |
18 |
|
Overimmigration Caused 60% of U.S. Population Growth
The immigration share of U.S. population growth rises continuously as
births to recent immigrants are added to the annual flow of new
arrivals. The usually reported numbers reflect annual flow. But this
flow does not fully represent the impact of mass immigration on population size
because the downstream effects, i.e., family formation and births, are
ignored.
|
1994 Category |
Native Born |
Foreign Born |
Total |
|---|---|---|---|
Immigration |
0 |
1,206,000 |
1,206,000 |
Births |
3,264,505 |
731,262 |
3,995,767 |
Deaths |
-2,074,136 |
-204,858 |
-2,278,994 |
Emigration |
-125,000 |
-125,000 |
(Est.) -250,000 |
Population Growth |
l,065,369 |
1,607,404 |
2,672,773 |
Percentage Share |
40% |
60% |
100% |
Analysis Carrying Capacity Network, and Dr. Virginia Abernathy. |
Confusion About NumbersAlthough the overall number of legal immigrants into the U.S. is readily available, there is no easy answer to the numbers authorized in each legal immigrant category. Despite much effort, no statement has been found that explains the number of immigrants that legally may be admitted to the U.S. each year. Even the 1994 U.S. Commission on Immigration Reform, chaired by Barbara Jordan, produced no such statement.45, 46, 47 The difficulty arises because the numbers vary from year to year due to a mixture of statutory law, administrative procedures, and prior year admissions. The following table presents current data as accurately as possible, and includes the Jordan Commission's recommendations.45, 46, 47 |
Legal Immigrant |
1996 U.S. |
Current |
Jordan Commission |
|---|---|---|---|
Family sponsored |
596,264 |
Limits are "pierceable" |
400,000 |
Employment-based |
117,499 |
About 140,000 |
100,000 |
Diversity programs |
58,790 |
About 55,000 |
- |
Refugee adjustments |
118,528 |
About 125,000 +/- 25,000 |
50,000 |
Asylee adjustments |
10,037 |
No practical limit |
? |
Other |
14,598 |
20,000+ |
? |
Total |
915,900 |
|
550,000 + |
Analysis courtesy Colorado Population Coalition |
Causes of U.S. population growth
The legacy of U.S. overpopulation we are leaving to future generations does not have to happen if we recognize and address the causes of our population growth.
Back to: Author: Fred Elbel. Edited by Dick Schneider. |